Survey of Pub Prices 2014
05/12/2014
Click here to open the pdf directly.
Welcome to Fleurets' annual Survey of Pub Prices which contains statistics and analysis of the sales and lettings of public houses we concluded in the year to September 2014.
The last 12 months has seen a turning point in activity, involving the switch from being a market dominated by large volumes of predominantly forced or distressed disposals, to being a divided market with regional discrepancies in activity levels and transactional characteristics.
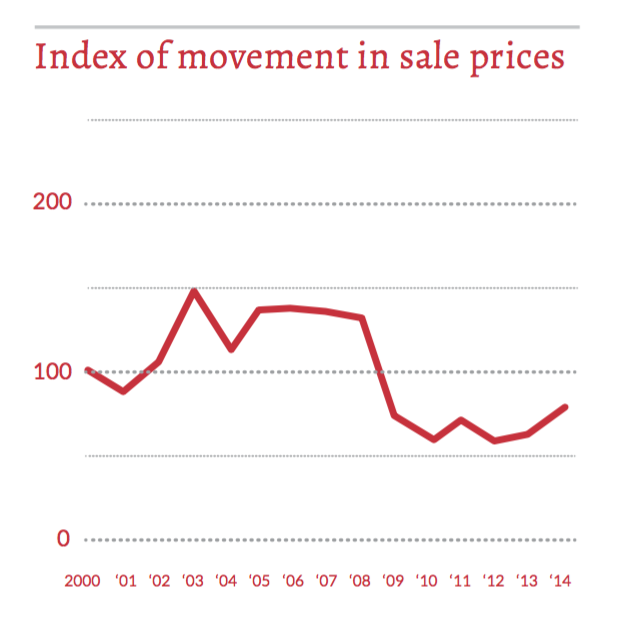
With improving trading figures, growing confidence, increases in residential prices and continued low interest rates, conditions have been ripe for a growth in value, but with the availability of finance continuing to be restricted and varying states of economic recovery around the country, the changes in sale prices we have experienced has been regionally inconsistent.
HEADLINE POINTS
National
- Average combined freehold sales price up 15%.
- 28% decrease in sales volume.
- Average leasehold sale price up 23%.
Bottom-end freeholds
- Average sale price £243,582 (up 12%).
- North up 9%.
- South up 12%.
- Sales volume down 25% (greater in the North).
- 57% of sales in the North (from 60%).
- Growth greatest in South Coast (29%) & East (24%).
Freehouses
- Average sale price £726,862 (up 24.8%).
- North down 18%.
- South up 32%.
- Sales volume down 25% (South 20% North 43%).
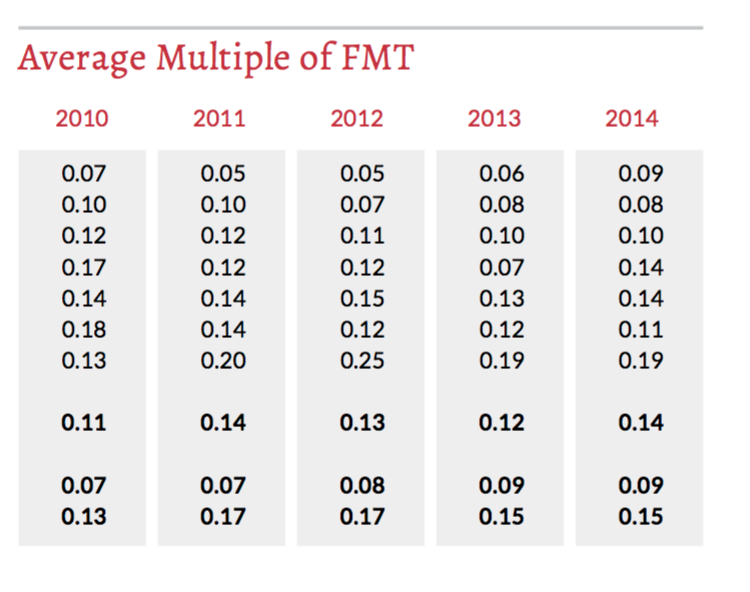
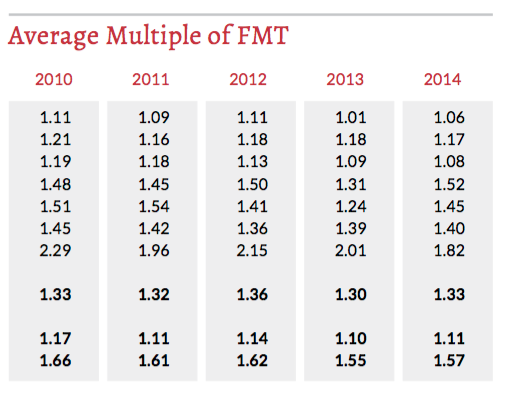
- Multiple of FMT (Fair Maintainable Trade) up in the South but down in the North.
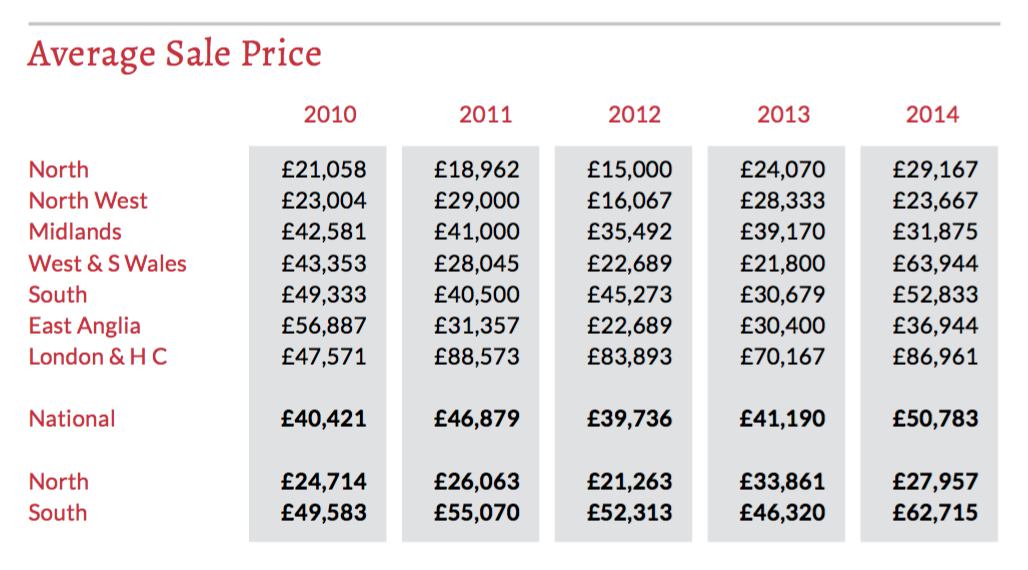
Leaseholds
- Average sale price £50,783 (up 23%)
- North down 17%
- South up 35%
- Sales volume fairly static (0%)
- 100% more sales in the south than north
- 48% tied lease transactions, up 12%
Basis of Statistics
This is a review of the deals actually concluded by Fleurets in the 12 month period to the 30th September 2014. It is not an analysis of the movement in market value for a fixed set of properties, as the property transactions included are different every year.
It partly provides an indication of the movement in value but also reflects the quantity and quality of properties that have been transacted in the year. The commentary provided on the market activity in each of the three sub sectors should be considered in context to fully understand and interpret the statistics provided.
The breakdown of the data includes a split on a north/ south basis where 'North' includes deals from our Leeds, Manchester and Birmingham offices and 'South' includes deals from our London, Brighton, Bristol and Sudbury offices.
Our Analysis is divided into 3 categories
Bottom End Freeholds
These are properties generally sold without accounts, sometimes closed or vandalised or, if operational, under temporary tenancy/management arrangement. These are primarily Pub Company sales but also include administration sales and occasional private sales. Invariably they reflect some form of forced sale situation.
Freehold Freehouses
These are generally better quality pubs sold with the benefit of accounts with an unrestricted marketing period. They are operational and typically viable businesses, usually sold by private individuals but also by managed house operators and not in a distressed situation.
Leaseholds
This group covers a wide spectrum of properties including high street bars, community locals and destination food houses. The transactions include free of tie and tied deals, on assignment, letting and underletting. Some deals reflect a negative value due to reverse premiums being paid or sub lettings at a lower rent than the passing rent.
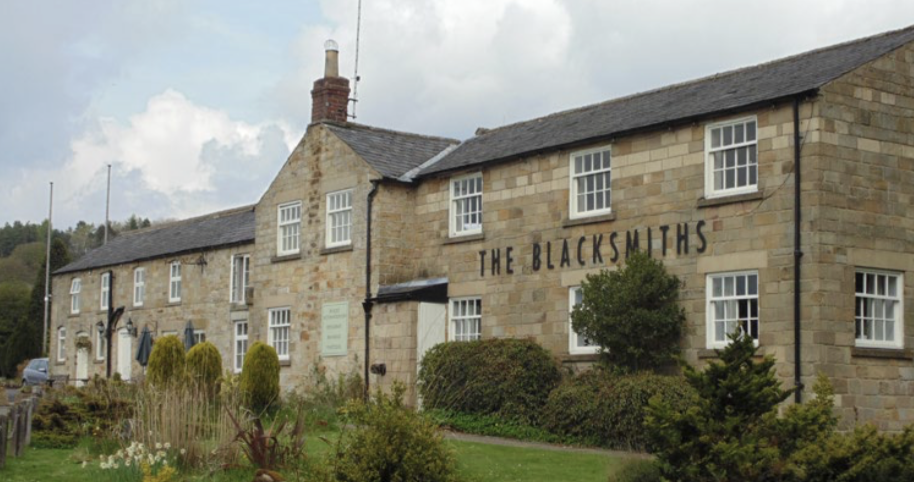
The Blacksmiths Arms, Pickering
Free of Tie lease assignment
Overview - Freehouses
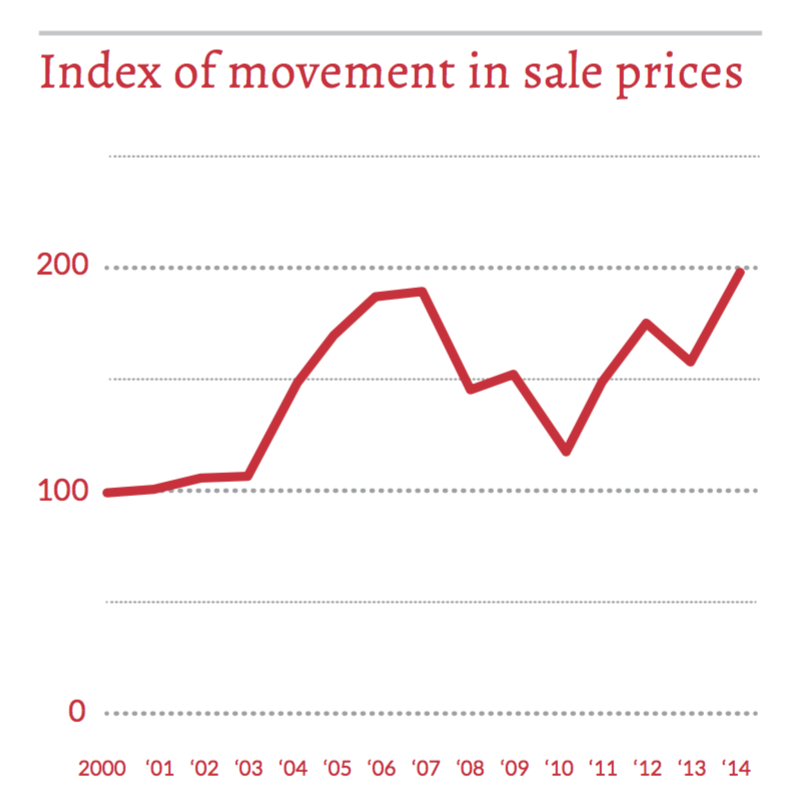
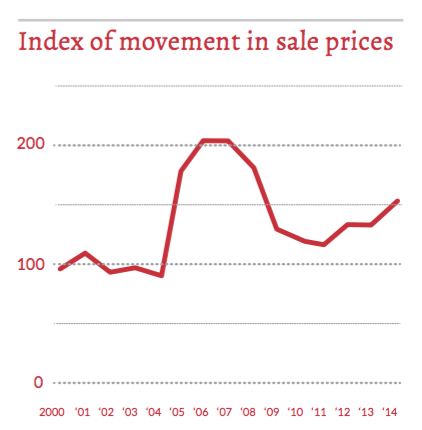
In 2014 the average sale price of a freehold freehouse increased by 25% to £726,862, 5% ahead of the average price achieved in 2007. It was, however, a market dominated by activity in the South with a rise in the number and value of properties transacted.
The disposal of public houses inside the M25 accounted for half of the freehouses we sold in the Southern region last year. This resulted in the average sale price increasing 32% across the South, lead by the South Coast region and London & the Home Counties.
We saw a number of multiple operators being prepared to dispose of some core sites to take advantage of exceptional pricing bolstered by foreign investors seeking to capitalise on low interest rates and secure long term prospects in the London market.
The West region saw a significant increase in activity with the volume of sales more than trebling from the previous year and the average sale prices increasing by over 50%.
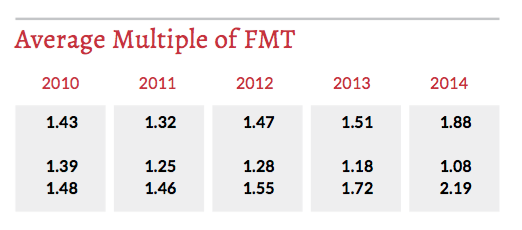
The disparity between North and South has never been more obvious. The Northern market was down on the number of transactions, down on the average sale price and down on the multiple of Fair Maintainable Trade (FMT). In contrast, the Southern regions saw a jump in average sale price and an increase in the FMT multiple to over 2x for the first time since 2008.
Private owners of operational and viable public house businesses have yet to step into the market in significant numbers, but we have seen an increase in activity across the UK as sellers, prepared to dip their toes into the water, find the shortage of comparable supply is promoting encouragingly good levels of demand.
The year ahead
We expect to see an increase in the volume of freehouse transactions, as operators are attracted by increasing prices and improving market conditions.
Excluding premium London deals, we anticipate freehouse prices will continue to rise influenced by the strengthening residential market and growing economic confidence. The election next year may cause a period of uncertainty leading to a stalling in confidence and demand, so increases may be more subdued. With interest rates not expected to rise for the next 12 months and the first signs of positive levels of disposable income, trade levels are expected to improve and this will reinforce the anticipated increase in the sale prices of good quality sites across the board.
We anticipate further merger & acquisition activity following in the footsteps of the impending acquisition of Spirit by Greene King.
This is expected to lead to an increase in the supply of units to the market as decisions are made and rationalisation takes place. This might increase supply to the market at the top end although this is not likely to happen until later in the year.
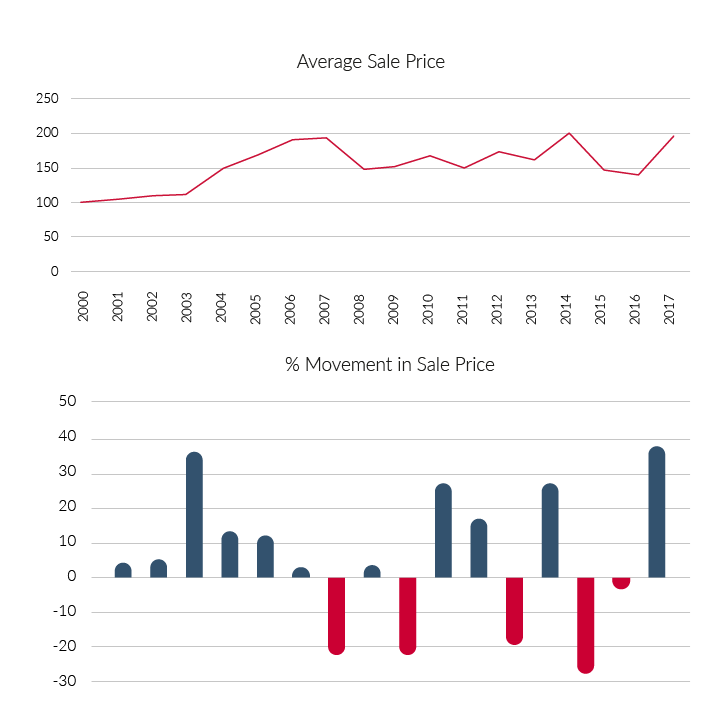
Overview - Bottom End Freeholds
This type of bottom-end freehold transaction, i.e. without accounts and invariably sold in a forced sale situation, has been the biggest influence on overall market activity and sale prices in the past 6 years. In the last 12 months however, the slow down of sales from the big six Pub Companies has changed the balance between supply and demand. This has not only impacted the average sale price of bottom-end pubs but also had repercussions in the freehouse andleasehold markets. Although overall volumes were down 25%, Bottom-end pub sales still accounted for 64% of all our public house transactions.
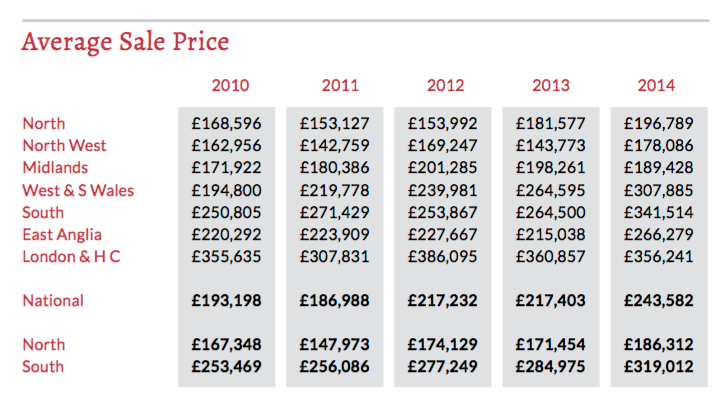
The reduction in supply, alongside the rise in residential values, the slightly higher quality of properties being sold and a growing confidence in the economy, saw the average sale price nationally increase by 12% to £243,582.
The increase has not, however, been consistent across the board. In the Northern regions sale prices increased between 5% and 10% and in the Southern regions values generally increased 20-25%. The exception was in London & the Home Counties, which remained broadly flat, although this reflected inferior stock compared with previous years.
The South Coast and East Anglia regions saw the highest increase in average sale price as the spin off from the South East residential market took effect, with 29% and 24% increases respectively, boosted by a number of particularly high value sales for alternative use in each region.
The vast majority of buyers in this area of the market have been individuals looking to operate as a freehouse or convert to a restaurant or to a single residence. A smaller number were acquired by the expanding regional brewers and/or local multiples.
Sales for alternative use have continued to play their part in the market. With the exception of a few deals, sale prices achieved for alternative uses were very much in line with prices achieved for continued pub use. There have, however, been an increasing number of deals agreed directly by the Pub Companies, particularly to the convenience store operators, often injoint venture arrangements.
The year ahead
Most of the tenanted Pub Companies have ended their mass individual sales programmes. A number of pubs will still be sold, however, we expect decisions will be based on traditional case by case estate management principles.
Following the Cerberus, Hawthorn and New River package deals, Pub Companies may seek to improve efficiencies and the average quality of their estates, by taking advantage of the growing interest in the sector from private equity, perhaps by selling packages of tenanted pubs.
We anticipate that banks will see the opportunity to withdraw support for some overstretched bottom end Pub Companies to crystallise their positions, and they will try to achieve this in the form of small package deals.
The average sale price of individual bottom end pubs is likely to continue to increase, driven by the growth in residential values and reinforced by reduced supply. We anticipate that the number of properties being sold for alternative use will decline as the viability and quality of operations coming to the market improves.
Overview - Leaseholds
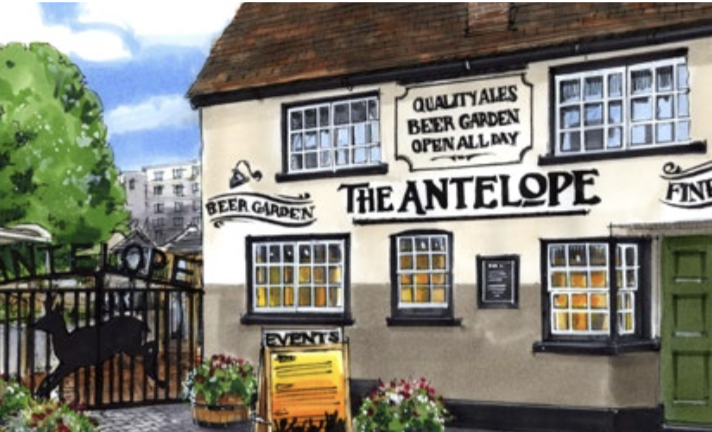
The Antelope
Tied Letting opportunity with significant Landlord investment
The leasehold assignment, subletting and lettings market started to see stronger signs of demand last year, with five out of seven regions seeing an increase in the average sale price. There was, however, a marked difference in the North compared with the South.
In the North the average sale price continued to disappoint, reducing in 2 out of our three regions whilst the multiple of Fair Maintainable Trade (FMT) remained static at 0.09x. This reflects an increased number of lettings, conducted on both tied and free of tie terms throughout the year, as opposed to a downturn in the market. Conditions have, however, remained tough.
In the South the average sale price jumped 35% but remained at a consistent multiple of FMT of 0.15x. This reflects an improved quality of units being transacted, an increase in the anticipated FMT as a result of a growing economic confidence and reducing numbers of affordable freehold opportunities for new entrants to pursue.
This performance was lead by the South Coast and West regions which both experienced a significant increase in the average sale price of 72% and 60% respectively, albeit exaggerated by a small number of premium deals and a low base point the previous year. The results were,however, supported by good volumes of above average deals.
We have seen fewer toxic lease transactions being concluded at reverse premiums or on sub-lettings with extended rent free periods.
Tied leasehold assignments and lettings increased, accounting for 48% of our transactions in this sector, up 12% from the previous year.
The North saw a higher proportion of tied lease deals than the South. The North sawpredominantly tied lettings rather than tied lease assignments which were more prevalent in the South.
The results reflect the disparity in the market between the North and South. There continues to be an oversupply of fairly average pubs in the industrial heartlands in the North. The economic regeneration and new found confidence that is common place in the South is less widespread in the North. There is always a market for the best sites and premium deals will happen across the UK, but the widespread availability is more apparent in the North and continues to affect sale price levels.
The year ahead
Increased flexibility, transparency and better quality operations being made available on both lease and tenancy terms, both tied and free of tie, will attract increased demand in most areas, as the supply of low cost freehold pubs reduces. This will be most prevalent in the south where freehold and leasehold pub supply is lowest and economic activity and confidence stronger. This will lead to a rise in activity and the best operations will see an increase in premiums.
In the North, the continued supply of new lettings from the Pub Co.'s and from private individuals/investors will delay the re-emergence of the assignment market and slow increases in the sale prices achieved. Attractive pubs in desirable areas and economically strong regions where there is no historic over supply of pubs, will lead the way.
The proposed legislation to entitle tied tenants to a free of tie market rent option at review, is not expected to materially affect Leasehold sale prices in the next 12 months. If it gets passed, it will not come into effect until at least autumn 2016 and it can only be triggered by the tenant at rent review, so it will take some time before the effects are seen in this survey.