Survey of Pub Prices - 2016
03/01/2017
Click here to view the complete PDF
Despite the political, legislative and economic uncertainty of the last 12 months the pub property market has reached the year end with relatively little turbulence. The sales mix has moved away from bottom end pub sales, leaseholds and packages to increased volumes of freehouse deals. This has resulted in an improvement in the quality of pubs being sold and an increase in the average sale price.
Market Overview
- Freehold sale price £363,543 +4.9%.
- Bottom end volumes down -28%.
- Freehouse volumes up +150%.
- Leasehold sale price down -18% to £39,801.
- Leasehold volumes down -20%.
- Brexit - no noticeable evidence of pricing adjustment.
- Improving overall quality and rising prices.
- Reduced portfolio/group activity.
- Pubcos being innovative to ease impact of MRO.
- Growing market of private Landlords.
- Tenant's/ LH buyers cautious due to MRO uncertainty.
The last 12 months has seen fewer package deals, fewer bottom end pub sales, fewer leasehold assignments and a significant increase in the volume of operational freehouse pub sales.
Brexit has not impacted on transaction volumes either individually or in packages, as many might have expected. A number of deals were lost and attempts were made to renegotiate the odd transaction at the time of the announcement, but on the whole deals that had been agreed went through as planned. On an individual level the attraction of very low interest rates and positive trading performance has seen purchasers prepared to simply "do some business", despite what may or may not happen in Europe.
At Corporate level, particularly for venture capital backed package deals, increased scrutiny alongside an underlying caution left some sitting back to see what happens. How long this continues remains to be seen, but deals are waiting to be done and temptation will eventually overcome caution. Trump-mania permitting.
The Pubs Code stuttered into existence on 21st July 2016, the key element of which was the Market Rent Option (MRO). Several months in, and we are still waiting to see what effect it will have on rents, values and market activity. Surprisingly for some it has not generated a flurry of disposals by pubcos seeking to avoid the effects of the MRO by selling off the problem. Instead pubcos have innovatively managed the impact by offering new tenancies not leases, offering existing lessees attractive deals to move to new agreements, in some cases buying back leases and, of course, setting up managed divisions capable of taking pubs under their control at lease expiry.
What is perhaps more of a surprise is that, until the announcement about Punch Taverns in December, we hadn't seen any significant package deals from the major pubco operators. In a similar way that the Beer Orders of 1989 resulted in massive pub estate for brewery swaps to circumvent the legislation, many expected similar reactions to be seen.
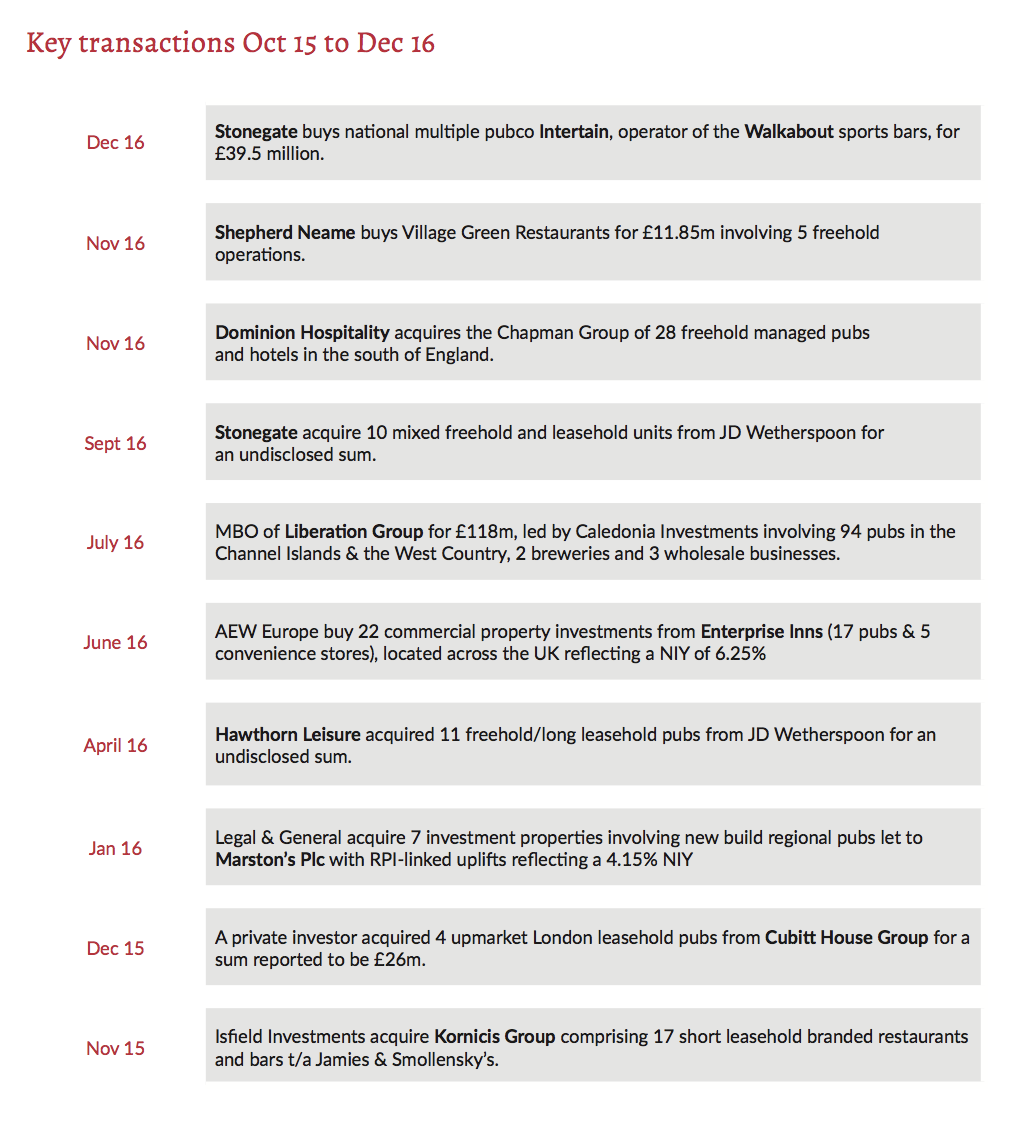
Portfolio Transactions (M&A Activity)
Having witnessed strong levels of portfolio activity in 2014 and 2015 there has been a significant reduction in group deals this year. 2015 deals included Tattersall Castle, GRS Inns, the New River Retail purchase from Punch and of course the Spirit sale to Greene King. 2016 has seen just 1 significant deal, being the Liberation Group MBO.
Freehold Freehouses
Headlines
- Sale price in the North up 18%
- Sale price in the South up 3%
- Freehold Freehouse transactions up 150%
- FMT multiples steady in the North but up 8% in the South
Commentary
The increased average sale price in the North reflects the improved quality of properties sold with fair maintainable trade (FMT) up 20%.
The small increase in sale prices in the South reflects a higher proportion of sales in the west region, which are generally lower than those seen on the south coast.
London witnessed a substantial increase in pricing up 45%. Our highest sale was an off market deal on the Commercial at Spitalfields Market, which sold for £4.65m.
Insight
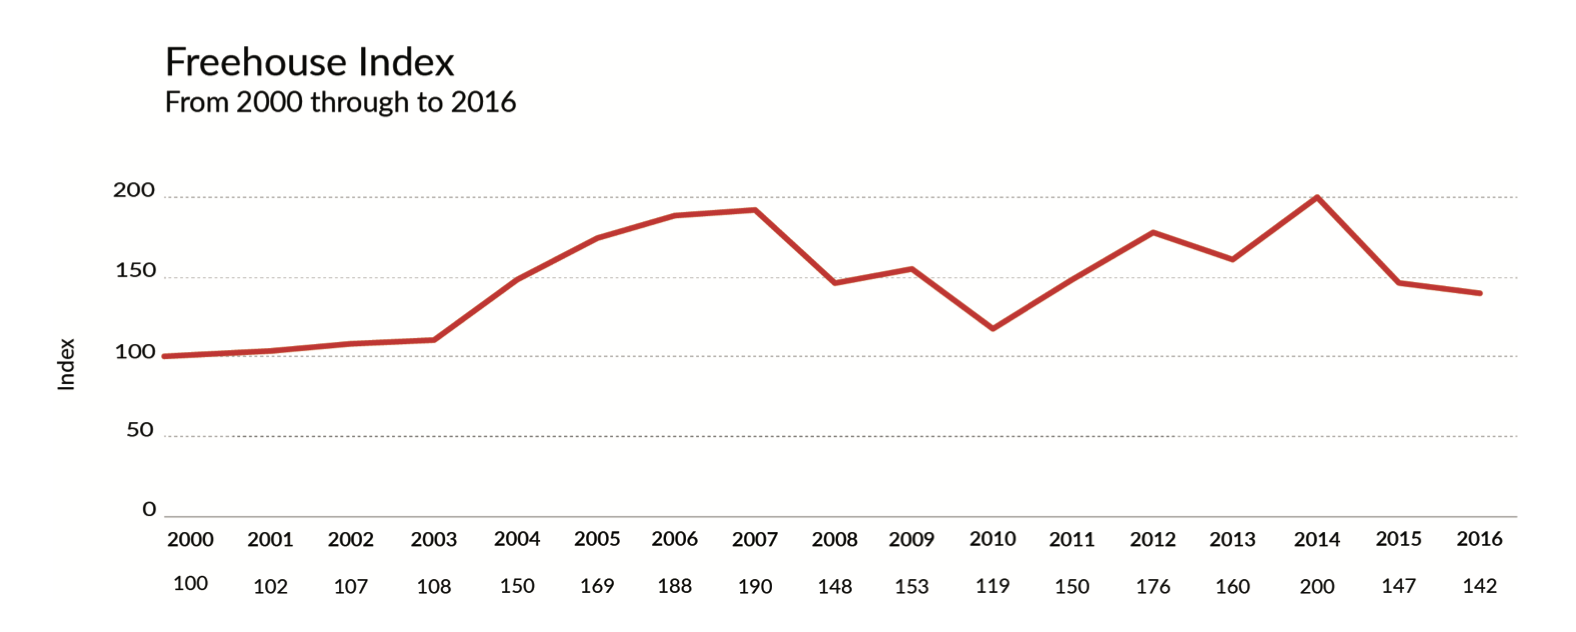
Since 2008 this market has been subdued. Operational and profitable businesses have not transacted in any great numbers. Unless there has been some external influence encouraging the decision to sell, Vendors have chosen not to do so. In the private market, this might be due to health concerns or personal needs, whereas in the Corporate sector it might be a result of financial pressure to meet loan repayments or Banking covenants. The majority of sales of operational and profitable pubs up to early 2015 had an element of external pressure.
In 2015 the fading memory of the recession and positive reports of on-trade performance, stimulated increased activity. H2 of 2015 saw double the sales in H1. This continued into 2016 with transaction volumes increasing over 150%.
Private individuals are increasingly prepared to sell and more corporate managed house operators have started to churn their estates, taking the opportunity to move into the gap vacated by the large tenanted pubcos, who have all but stopped their disposal programmes.
The Year Ahead
Much depends on the world economy post the Brexit vote and Trump election. The only certainty is uncertainty. However, in the year ahead:- we will still be part of Europe, interest rates will remain low, taxation might ease on the pub sector and performance will be resolute. We anticipate activity will remain solid in transaction numbers and prices are likely to show more modest growth, as the increased rates burden affects the bottom line profitability for many programmes.
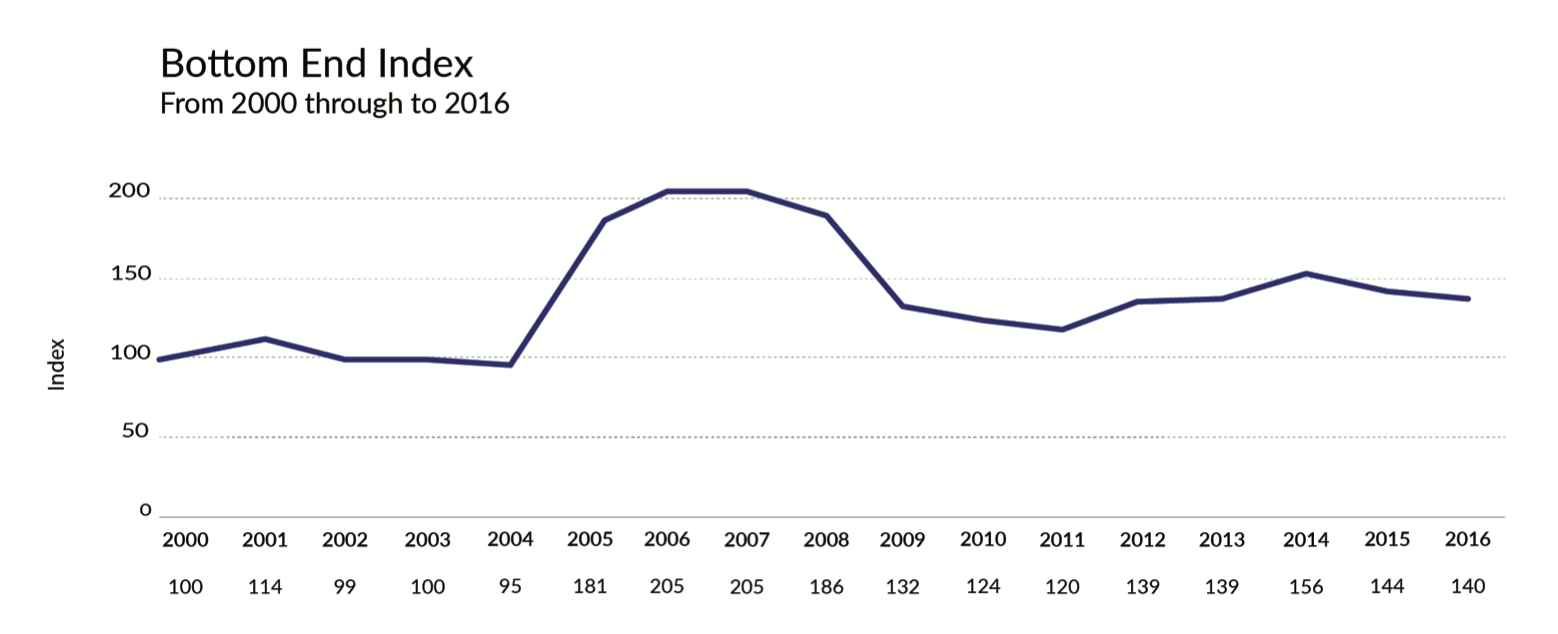
Bottom End Freehold Pubs
Headlines
- Sale price in the North up +0.6% to £184,521
- Sale price in the South up +3.4% to £311,718
- Transactions down -28%, more in the South
- FMT up +2.6%
- FMT multiples averaged 1.19 (1.26)
Commentary
The sale price in the North reflects a degree of polarisation with an increased volume of low value administration sales hampering the general increase in prices of better quality Pubs.
The average sale price in the South represents varied activity across the regions, being up in 2 regions and down in 2 regions. The increase in sale prices in London (+10.9%) increased the overall average.
The lowest freehold pub sale was £40,000 for the Spread Eagle in Accrington, which stayed as
a Pub and continues to trade at £2,000pw. 12 freehold pubs sold for under £100,000. 10 of which were in the North West, 1 North and 1 Midlands.
Insight
The bottom end sector has been dominated by the big 6 tenanted pubcos since the recession
in 2008, up until mid 2015. Since then the pressure to sell has abated and disposals now trickle through based on normal estate management decisions.
The volume of transactions in the last 12 months declined -28% (-23% 2015).
Vendors included a variety of smaller multiple operators, regional brewers, administrations and a handful of individuals.
Demand has remained strong, led by cash backed purchasers, as finance remained difficult to obtain in this sector with typically 50-60% Loan To Value all that is available.
With a higher average sale price and a higher average FMT, the quality of pubs being sold improved, reflected by the increased proportion of pubs remaining as pubs after they were sold, rising significantly to 60% (46%).
The Year Ahead
Despite Brexit, Trump-mania, MRO and uncertain economic conditions, we do not envisage the bottom end pub market will change much over the next 12 months. Supply is unlikely to increase materially as the big pub owners are not under pressure to sell. Values should continue to improve at the bottom end, in some cases helped by small business rates relief offsetting increases in the living wage due in 2017.
Leasehold
Headlines
- Sale price down -18% to £39,801 - similar in North & South
- FMT multiple down from to 0.11 (0.13) with similar reductions in North & South
- Transactions down -20% with bigger decrease in the North.
Commentary
The reduction in the average sale price is partly down to the increased proportion of nil premium lettings as opposed to sales, and partly down to the MRO legislation and election/Brexit insecurity.
The increased letting activity 64% (53%) results from more private owners letting instead of selling as finance on leaseholds continued to be difficult to obtain in the Licensed sector.
The sale price in the South has been driven by a reduced number of premium sales in London and increased letting activity on the south coast. It also reflects a reduction in the quality of property being transacted, evidenced by the average FMT being down -7%.
The sale price in the North has been influenced by a number of high premium deals in Birmingham last year not being repeated and a small reduction in the quality of property being transacted, evidenced by the average FMT being down -4%.
Insight
It has been a difficult year in the leasehold pub market with many factors playing their part in
influencing the results of this yearly review.
The uncertainty that has prevailed over the Pub Code and MRO legislation has impacted
on the leasehold pub market. The actions being taken by some of the big 6 pubcos increased
the uncertainty over the leasehold assignment market. The legislation came into force in May
2016 only to be withdrawn and not issued again until 21st July thereby creating huge turmoil
for many existing and potential tenants. Even though it has now been implemented there is
little clarity as to how the market will react. This looks set to continue well into 2017.
Given the political and legislative activity, the leasehold market has displayed remarkable resilience. New lettings and existing business assignments have continued in all regions and we have seen significant premiums with 12% of our transactions involving 6 figure premiums.
Letting volumes suggest a growing willingness to take on what are often closed pubs in need
of considerable investment. It also suggests an increase in available opportunities not only from
the pubcos but increasingly from private owners choosing to let instead of sell their freehold
business. This reluctance to sell is interpreted partly as a desire to retain the property asset
but also to open up new avenues of marketing when the freehold is difficult to sell at an
acceptable price.
The Year Ahead
We anticipate the increase in new free of tie lettings will continue, from a wider variety of Pub owners. Premiums for tied leasehold agreements will be suppressed as the effects of MRO take effect. More surrender deals will be agreed and we will see the growth of more multiple operators of free of tie leased estates emerge.
Our Analysis is divided into 3 categories
Bottom End Freeholds
These are properties generally sold without accounts, sometimes closed or vandalised or, if operational, under temporary tenancy/management arrangement. These are primarily pub company sales but also include administration sales and occasional private sales. Invariably they reflect some form of forced sale situation.
Freehold Freehouses
These are generally better quality pubs sold with the benefit of accounts with an unrestricted marketing period. They are operational and typically viable businesses, usually sold by private individuals, but also by managed house operators and not in a distressed situation.
Leaseholds
This group covers a wide spectrum of properties including high street bars, community locals and destination food houses. The transactions include free of tie and tied deals, on assignment, letting and underletting. Some deals reflect a negative value due to reverse premiums being paid or sub lettings at a lower rent than the passing rent.
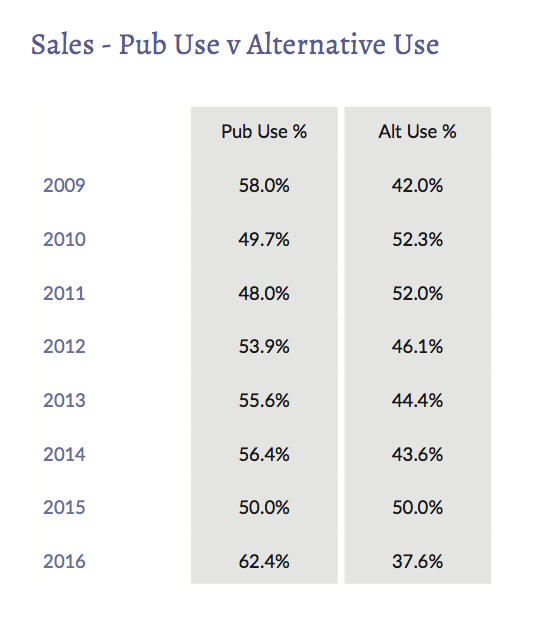
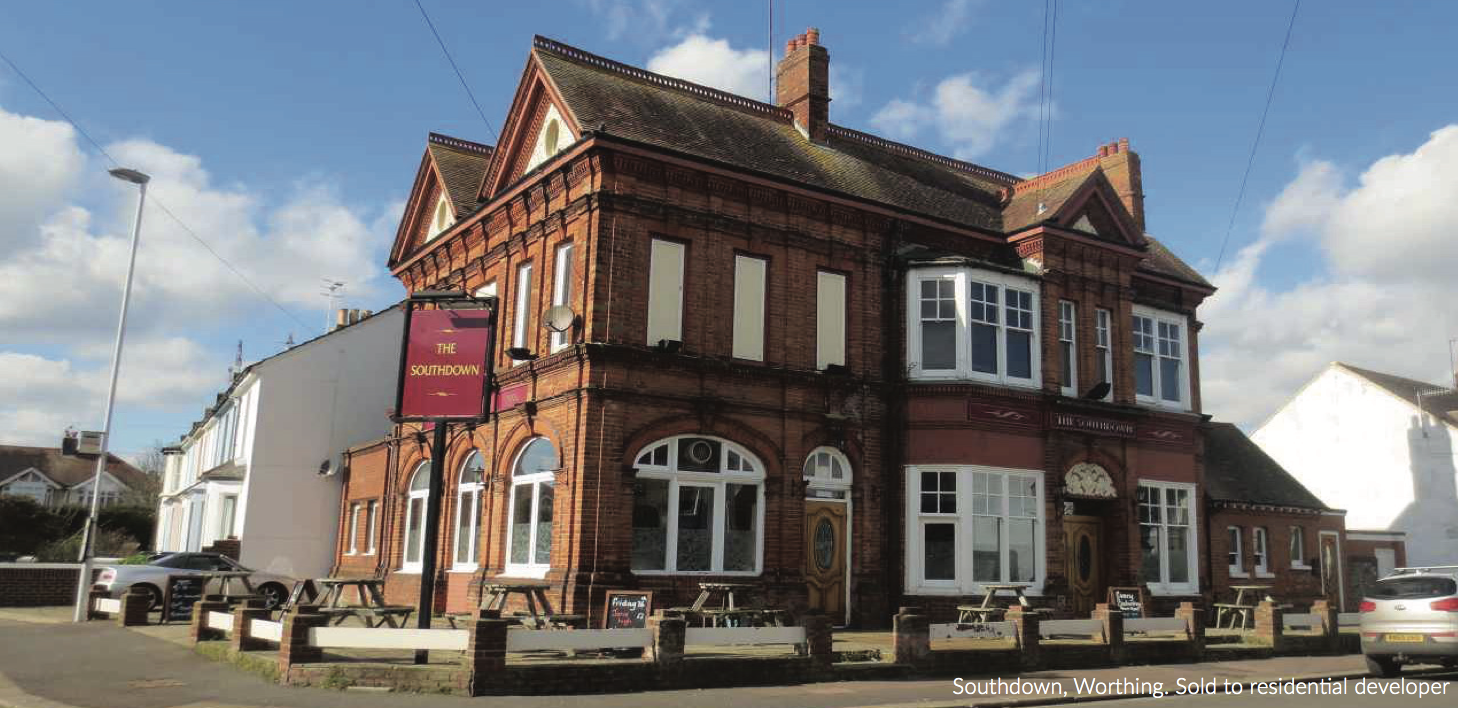
PUB SALES - Alternative Use Sales
- 62% of all Freehold Pub sales remained as pubs
- 69% in the South and 59% in the North
- All pubs sold for pub use were sold on average for 38% more than for non pub us
- Bottom end sales for pub use saw average sale prices -6.7% lower than alternative uses in the North and -8.5% lower in the South.
- Freehouse sale prices were 54% higher for pub use than alternative use
In a marked change to the previous 8 years, 2016 saw the number of pubs sold for continued pub use leaping to 62.4% compared to a typical range between 48% and 52%. In the South this was even higher at 69% of pubs sold, continuing as a pub use.
There was little differential for freehold freehouse sales, where North and South were much the same at 65% and 67% sold for pub use respectively. The bottom end freehold sales however, saw a wider variation with 71% in the South and 56% in the North staying as pubs.
Out of all the freehold pubs Fleurets sold, the average sale price for a pub use was 38% higherthan the average sale price for alternative uses, with a similar differential between North and South.
These statistics suggest that the average quality of pubs being sold has increased. This issupported to some extent by an increase in the average FMT by 2.1% for freehouses and 2.6%for bottom end pubs, but also by the mix of sales, with a higher proportion of transactions being seen in the South and with fewer bottom end sales.
Looking a little deeper into the numbers reveals that higher pub value is not found in all areas. The sale price of bottom end pubs sold for pub use was -6.7% lower than for alternative use inthe North and -8.5% lower in the South. This suggest that there are still a number of more marginal pubs that don't have great value for pub use and which the market determines arebetter utilised for alternative uses.
It is often the viability of pubs that determines the future use and not higher development value. There remains a number of less viable pub sites being transacted in the North, with bottom end sales having significant numbers converted into a variety of other uses on sale.
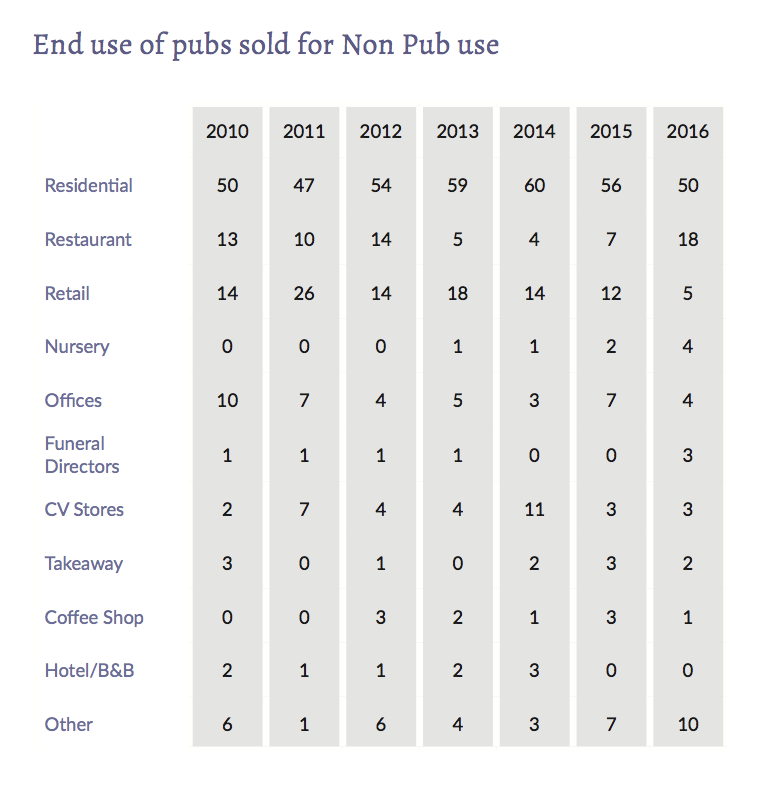
Out of the pubs sold for alternative use the largest proportion were sold for residential use 50%, Restaurant use increased significantly to 18% of all alternative uses (7%), whereas retail uses declined to just 5% of sales (12%). The now ubiquitous Convenience Store stayed at just 3% of overall non-pub uses.
As usual alternative uses varied greatly including:- Art Gallery, Care Home, Antiques Showroom, Funeral Directors and Social Club amongst others.