Survey of Pub Prices
05/01/2018
Click here to view the complete PDF
Property transactions in the pub market have shown remarkable resilience over the past year, despite political and economic uncertainty and the added burden of recent sector legislation. Activity and sale prices have been driven by the increased quality of transactions with higher trading levels and decentralisation leading to premium prices being paid for the best regional assets.
Market Overview
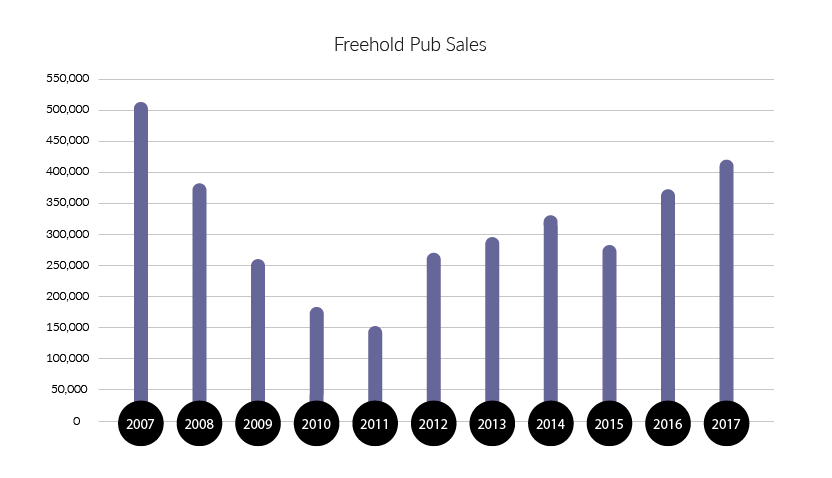
● Combined Freehold sale price £416,624 +14.6%
● Freehouse sales volume down -24.1%
● Fewer but bigger portfolio deals
● Bottom End sale price £271,998 +24.5%
● Leasehold sale price +31% to £51,980
● Leasehold volumes up +24.4%
● Growing market of private Landlords
● Improving quality of disposals
The pub market is very diverse, ranging from large food-led managed houses to high street bars, and from privately owned freeholds to leases and lettings (tied and free of tie). Overlay geographical variations of town, suburban and rural as well as the regional variations - north, south, east and west, and it becomes impossible to generalise about the state of the market. Some market characteristics however, are common across the country, whilst others vary region by region. Below I have summarised the common ground and the aspects that vary between north and south.
Common market characteristics
- Tenanted pubcos have continued to selectively shed under performing sites, with the most active and creative being Ei Group, who have not only sold individual sites, but they have sold packages of investment properties as well as expanding their managed estate. They have also taken great strides in offering large numbers of properties on free of tie leases - for all uses, not just for pub use.
- The reduced supply of bottom end freehold pubs has continued. Lower supply along with continued strong demand for these sites, has led to an increase in the sale price of lower end properties.
- We have seen an increase in demand lead to higher prices being paid for units in city centres and higher value towns. More buyers looking to decentralise from the London market, local operators seeking to expand, developers looking for an alternative use angle and investors seeking to secure assets in prime locations have all been active in the market.
- 2017 saw an increase in the number of free of tie lettings being offered to the market, notably from Wellington Pub Company and more recently the Ei Group, but also from private owners seeking to retain their asset and generate rental income rather than sell.
- A very selective freehouse market with prime sites selling for high premiums and more off market transactions taking place.
South & West characteristics
- Increased leasehold assignment activity, both tied and free of tie, but a polarisation of the market seeing the best sites selling for higher premiums and the smaller wet led community sites often unsaleable for a premium.
- Increased demand for higher value freeholds outside the M25, due to the overspill from the overheated London market. The focus being on regional hotspots across the South and West, such as Brighton and Bristol. Demand however, remains very selective and limited by available cash finance in the private sector.
North & Midlands characteristics
- Without development opportunities or corporate purchaser interest, higher value freeholds witnessed low levels of demand, with available cash being the primary limiting factor.
- Owners were increasingly offering new free of tie leases with an option to buy the freehold in order to achieve an exit from operating the larger businesses.
- Leasehold assignments continued to be very limited due to an abundance of nil premium opportunities, often on better terms. The lack of activity of tied lease assignments was compounded by the uncertainty over the lease renewal position due to MRO regulations and pubco activity.
Note: All statistics have been taken from detailed analysis of transactions completed by Fleurets, where first hand information is available. They do not purport to reflect all market transactions.
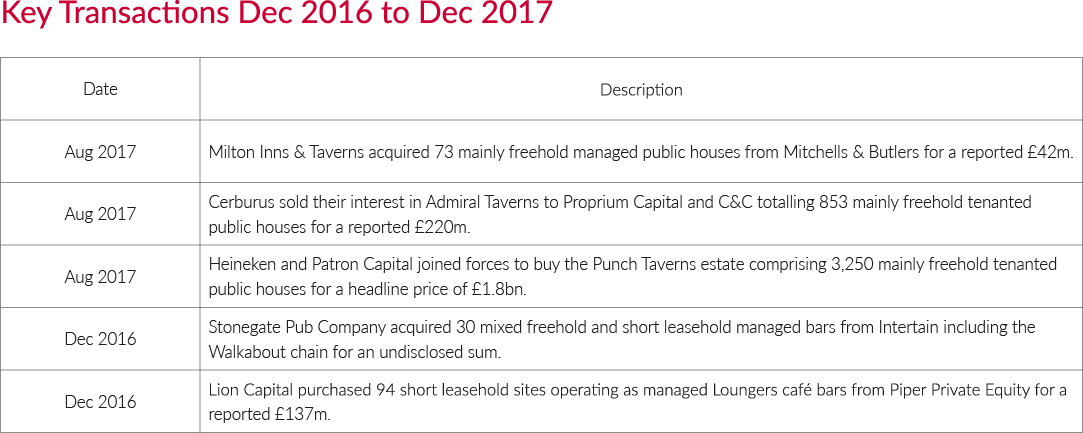
Portfolio Transactions
Market activity for package deals was dominated in 2017 by the sale of two of the three largest tenanted pub groups in the country. Heineken and Patron Capital split the Punch Taverns estate (3250 units) and Proprium Capital and C&C acquired Admiral Taverns (853 units). These transactions showed great confidence in the continued viability of the traditional pub and the tenanted pub model, especially coming at a time when the effect of the MRO legislation is yet to be fully appreciated.
Increasing supply costs, the rates burden, National Living Wage increases and rising utility costs have put great pressure on managed operations over recent years, and as a result we saw sizable disposals in late 2016 and 2017 from a few managed house operators. These were a mix of package transactions and individual sales from Greene King, JD Wetherspoon and most recently a package from Mitchells & Butlers, which sold to a new entrant into the operational market, Milton Inns & Taverns.
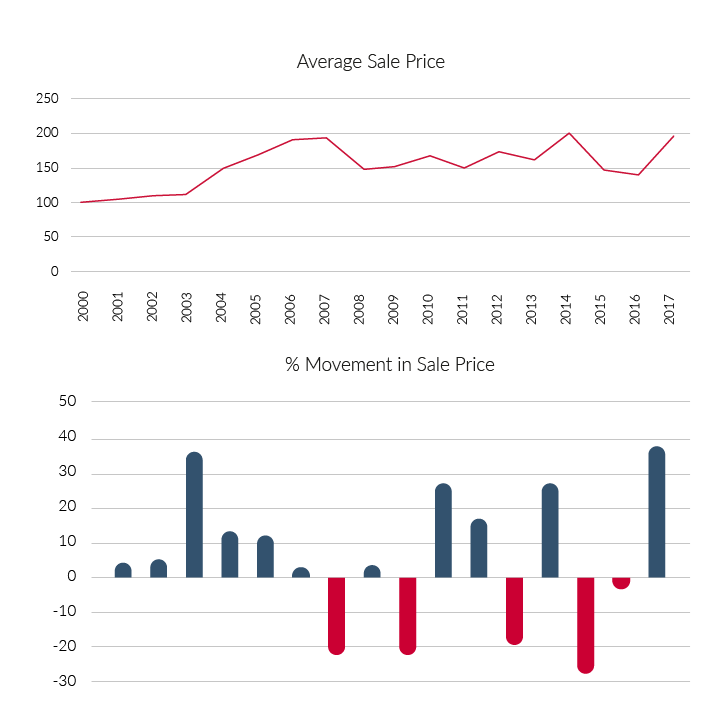
Freehold Freehouses
● Average Freehouse sale price £710,467
● Sale price in the North up 12% to £359,700
● Sale price in South up 24% to £876,614
● Average FMT of Freehouses sold up 21%
● Multiple of FMT up in the North at 1.1 and static in the South at 2.19
(FMT - Fair Maintainable Trade)
The average sale price of freehold freehouse pubs increased 38% nationwide reflecting, in
part, a higher proportion of sales being in the South, but also an increase in sale prices in both
the North and South.
The quality of pubs being transacted increased with the average Fair Maintainable Trade in the
North up 9% and in the South up 24%.
The volume of freehouse sales was marginally up in the South but significantly down in the
North.
We saw a higher proportion of high value deals, with 20% of sales in the South being over £1m,
led by central London and Bristol.
Despite the leap in the volume of transactions in H2 2016 potentially signalling a new dawn of a more active and fluid market, 2017 saw a 24% drop in the number of freehold freehousetransactions. This was perhaps a reaction to the uncertainty over Brexit.
Although the number of freehouses sold reduced, the quality increased with average FMT up 20%. This was compounded by an increase in the sale price as a multiple of FMT, which was up 14%, and a geographic distribution moving more to the south, resulting in a significant increase in the average sale price of freehold freehouses up 38% to £710,467.
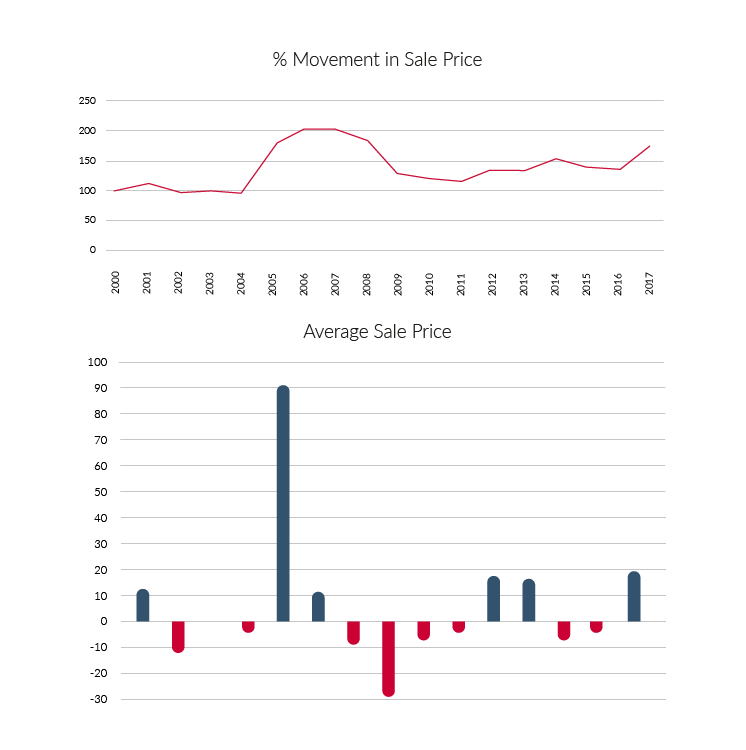
Bottom End Freehold Pubs
● Sale price in the North up 14.6% to £211,510
● Sale price in the South up 16.6% to £363,324
● National sale price 1.21 times FMT, up from 1.19
● FMT of sold pubs up 14% in the North and up 26% in the South
● Sales volume increases 22%
2017 saw an increase in the volume of bottom end sales in the South especially outside the M25 with activity dominated by Ei Group. Activity was maintained in the North, with no dominant vendor but with a larger number of national and regional operator disposals.
The average sale price increased by 24.5% nationwide, this was as a result of an increase in
the quality of property being sold (with FMT up 14.3% in the North and 25.7% in the South) anda higher proportion of sales being concluded in the South.
The lowest value sales concluded were in the North West with 14% of sales below £100,000,the lowest being £65,000. The highest sale prices were spread geographically, with all regions concluding bottom end sales at over £500,000, the highest being £685,000.
Strong demand and limited supply has led to a significant increase in sale prices, in both the North and South. Buyers for pub use and development are mainly small scale or individual but are limited by available cash resources. Invariably for this type of asset a 50% cash stake isrequired before any additional funds for development or improvement are taken into account. This focusses demand on low value property that can be improved to add value.
Modestly trading units add little to the basic property value, with the sale price of trading orclosed pubs varying little from the sale price for alternative use.
Asset of Community Value (ACV) status continues to impact on the sale process of pubs at the bottom end of the freehold market, invariably reducing the ultimate sale prices achieved. Despite large numbers of properties being listed as ACVs and subsequently sold, very few were sold to the registered community group.
Leasehold Pubs
● National average sale price up 31%
● FMT up +16% and multiple of FMT up to 0.12 from 0.11
● North - sale price up £19,062 to £49,500
● South - sale price up £9,182 to £53,145
● Proportion of lettings reduces as more premiums are achieved
The average sale prices of leasehold pubs jumped significantly due, in part, to a small number of high premium deals, including five leasehold assignments in the North at over £100,000 andthirteen in the South, including two deals at over £400,000.
The leasehold market reflects fewer shell deals where no premium is paid and a smaller percentage of new lettings rather than assignments at 55% compared to 59% in 2016 and 64% in 2015.
Total sales volume was up 24% nationwide, comprising of a 30% increase in the North (from a very low base) and a 22% increase in the South. The average FMT of the properties sold wasup 16.3% to £419,261, reflecting a significant increase in the average quality of the operationsbeing transacted.
The average sale price as a multiple of FMT increased from 0.11 to 0.12 which shows that itwas not just the size of the property that led to an increase in the average sale price, but was also the value associated with the businesses that increased.
The leasehold market, however, continued to be difficult. The supply of pubs as new lettings or as nil premium leasehold assignments has remained high, giving buyers plenty of choice and keeping many premiums (including F&F) at or about one times the Ebitda.
We have seen a significant increase in the number of free of tie leases coming to the market. It was led by Ei Group offering a number of their pubs on free of tie deals, but also included the leading free of tie pubco Wellington Pub Company continuing to offer nationwide free of tie opportunities. Private owners letting their pubs out instead of selling them has increased supply, as have investors attracted by the higher returns available from pub lettings comparedto residential buy to let deals.
The other significant change is that the better, stronger sites have seen a growth in demand,
with higher premiums being paid for the best sites. These are mainly high street sites in the
primary cities and the best secondary towns, which have benefitted from the overflow from an
overheated London leisure market.
The 3 Pub Categories Explained
Bottom End Freeholds - These are properties generally sold without accounts, sometimes closed or vandalised or, if operational, under temporary tenancy/management arrangement. These are primarily pub company sales but also include administration sales and occasional private sales. Invariably they reflect some form of forced sale situation.
Freehold Freehouses - These are generally better quality pubs sold with the benefit of accounts with an unrestricted marketing period. They are operational and typically viable businesses, usually sold by private individuals, but also by managed house operators and not in a distressed situation.
Leaseholds - This group covers a wide spectrum of properties including high street bars, community locals and destination food houses. The transactions include free of tie and tied deals, on assignment, letting and underletting. Some deals reflect a negative value due to reverse premiums being paid or sub lettings at a lower rent than the passing rent.
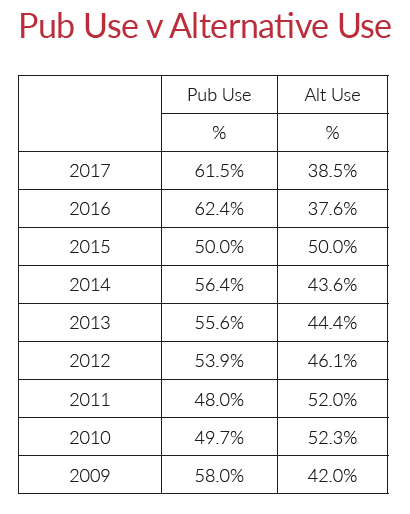
Pub Sales - Alternative Uses
● 62% of all freehold pub sales remained as pubs
● 68% in the South and 55% in the North
● Pubs sold for pub use were sold for 48% more than for non pub use
● Bottom end pub sale prices for pub use were 15% higher in the North & 1% lower in the South
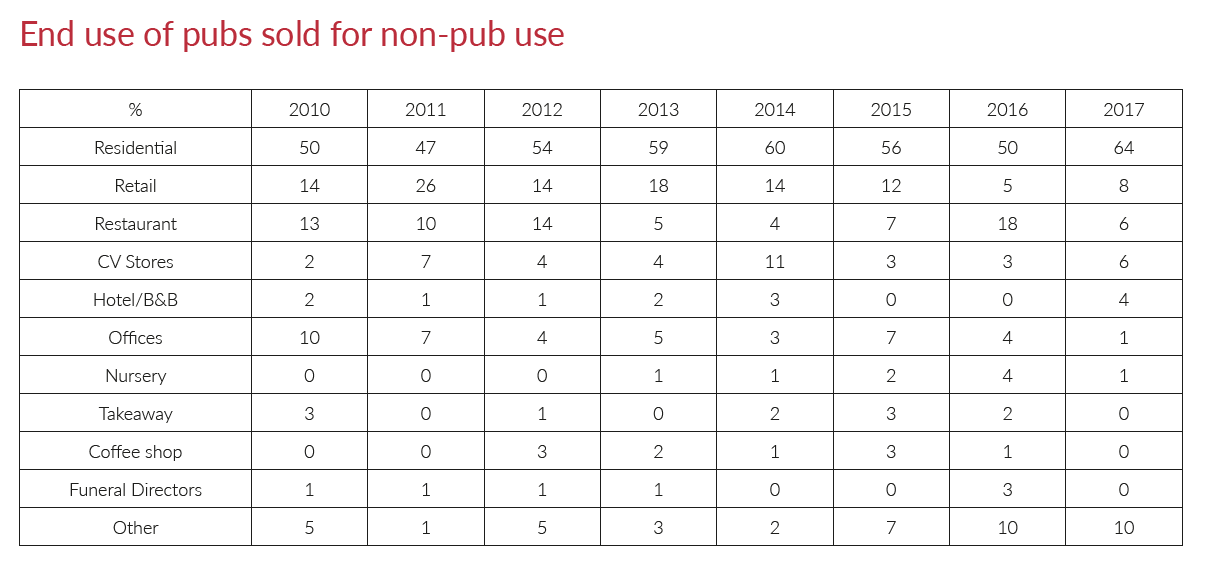
● Sales for residential use increased to 64% of non pub uses
2017 witnessed a continuation of the increased proportion of freehold pubs remaining as pubsafter they were sold, with 61.5% continuing to stay as pubs despite rising values for a variety of alternative uses. The percentage remaining as pubs was higher in the South, despite higher land values, with 68.3% staying as pubs compared to 54.6% in the North.
Understandably the freehouse market saw a higher proportion of sales staying as pubs at 67.8% compared to bottom end pubs where 58.6% remained as pubs. The lowest pub retention was for bottom end pubs in the North at 53.2% where the greatest oversupply of pubsis found due to the industrial history of many areas.
The sale price of pubs for continued pub use was 48.3% higher than for alternative use acrossall sales. This was most pronounced in the freehouse market, where sale prices for pub usewere 68% higher than for non pub use, where as bottom end pubs sold for pub use was just 6.5% higher. The only area where pub sale prices were higher for alternative uses was forbottom end pubs in the South, which showed a small differential at -1.4%.
The most popular alternative use was for residential development or conversion, whichincreased its share to 64% (from 50%) followed by other retail at 8%, restaurant andconvenience stores at 6% and hotel/guest house at 4%. A variety of other uses were present including traditional uses like:- offices, children's nursery and care home, but we also saw a number of more community based uses including:- an education centre, a community centre, a performing arts centre and a sports & social club. Interestingly, none of these more community based purchasers were as a result of the pub being listed as an Asset of Community Value.
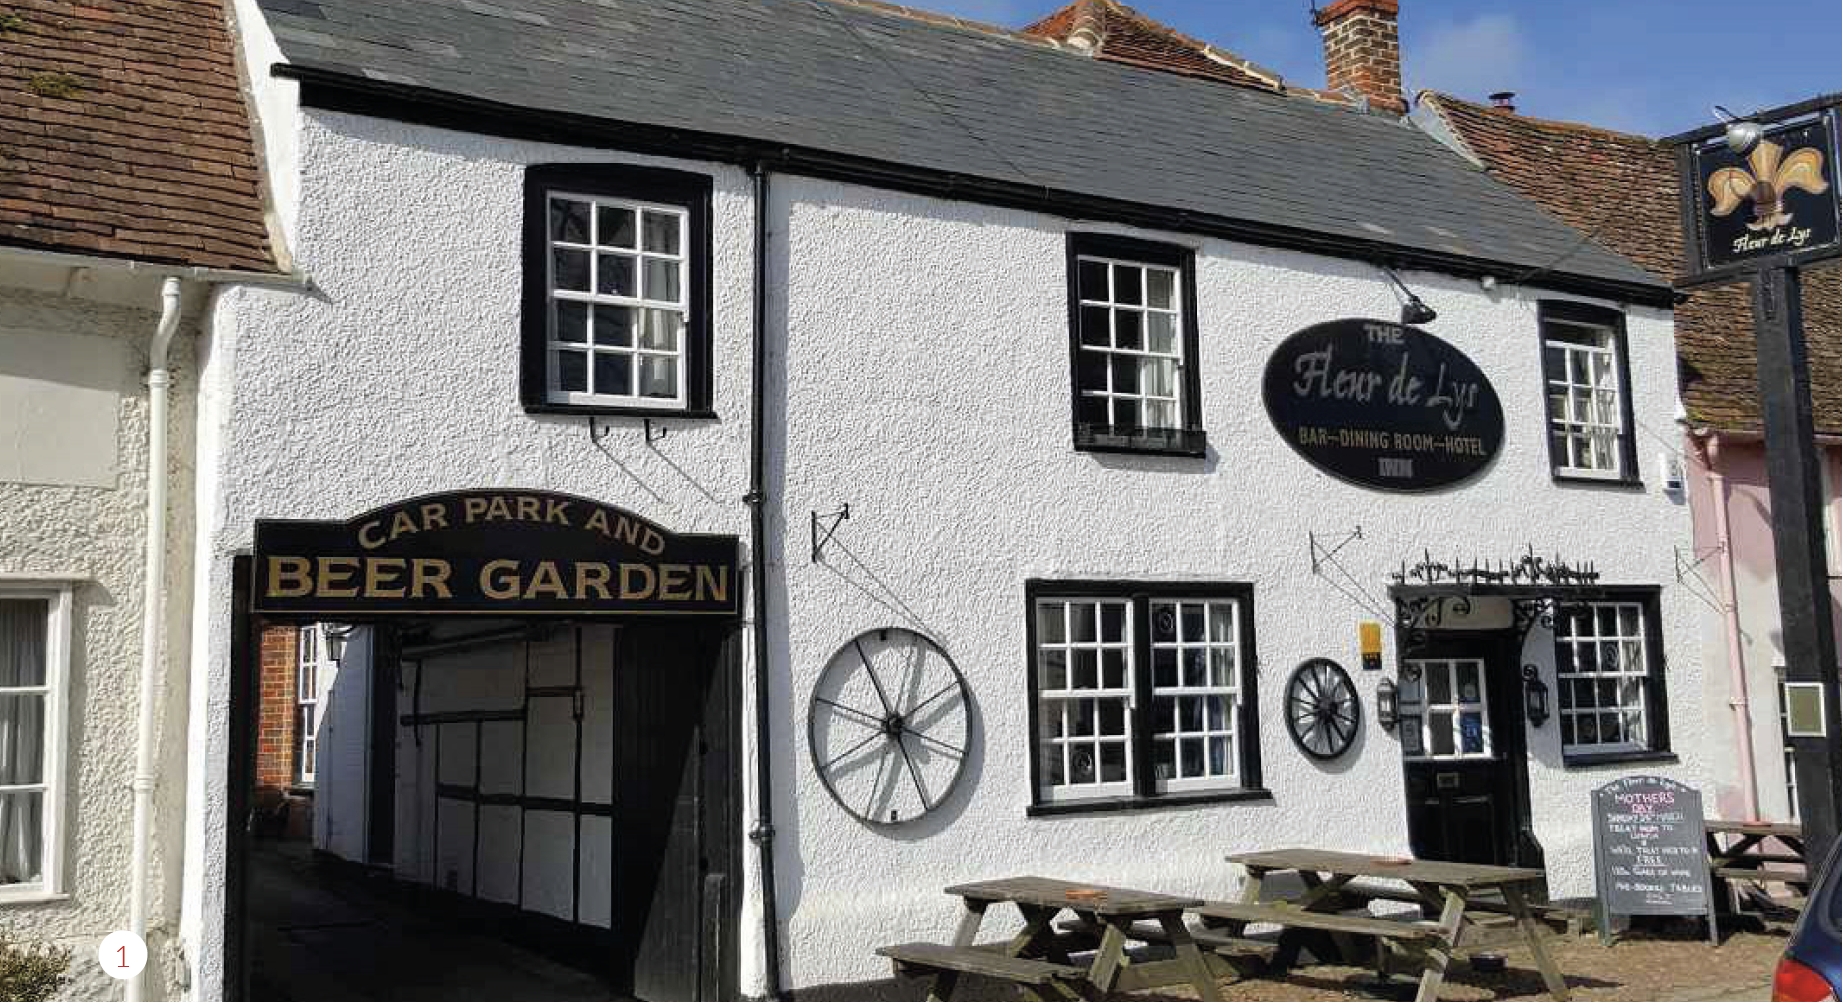
1. Fleur De Lys Inn, Dorchester on Thames
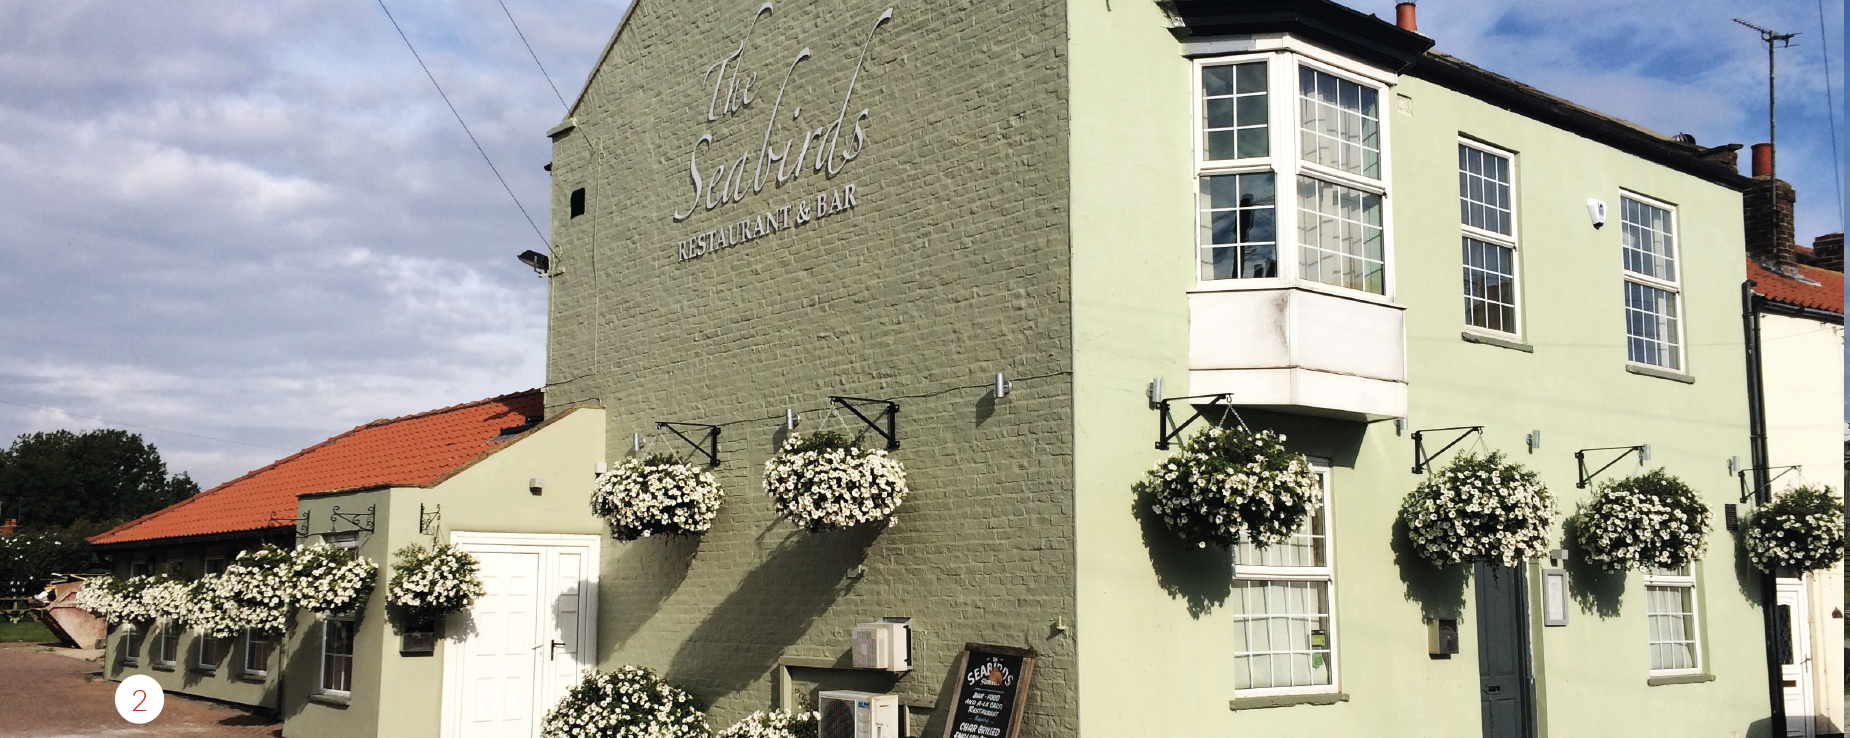
2. Seabirds Inn, Flamborough
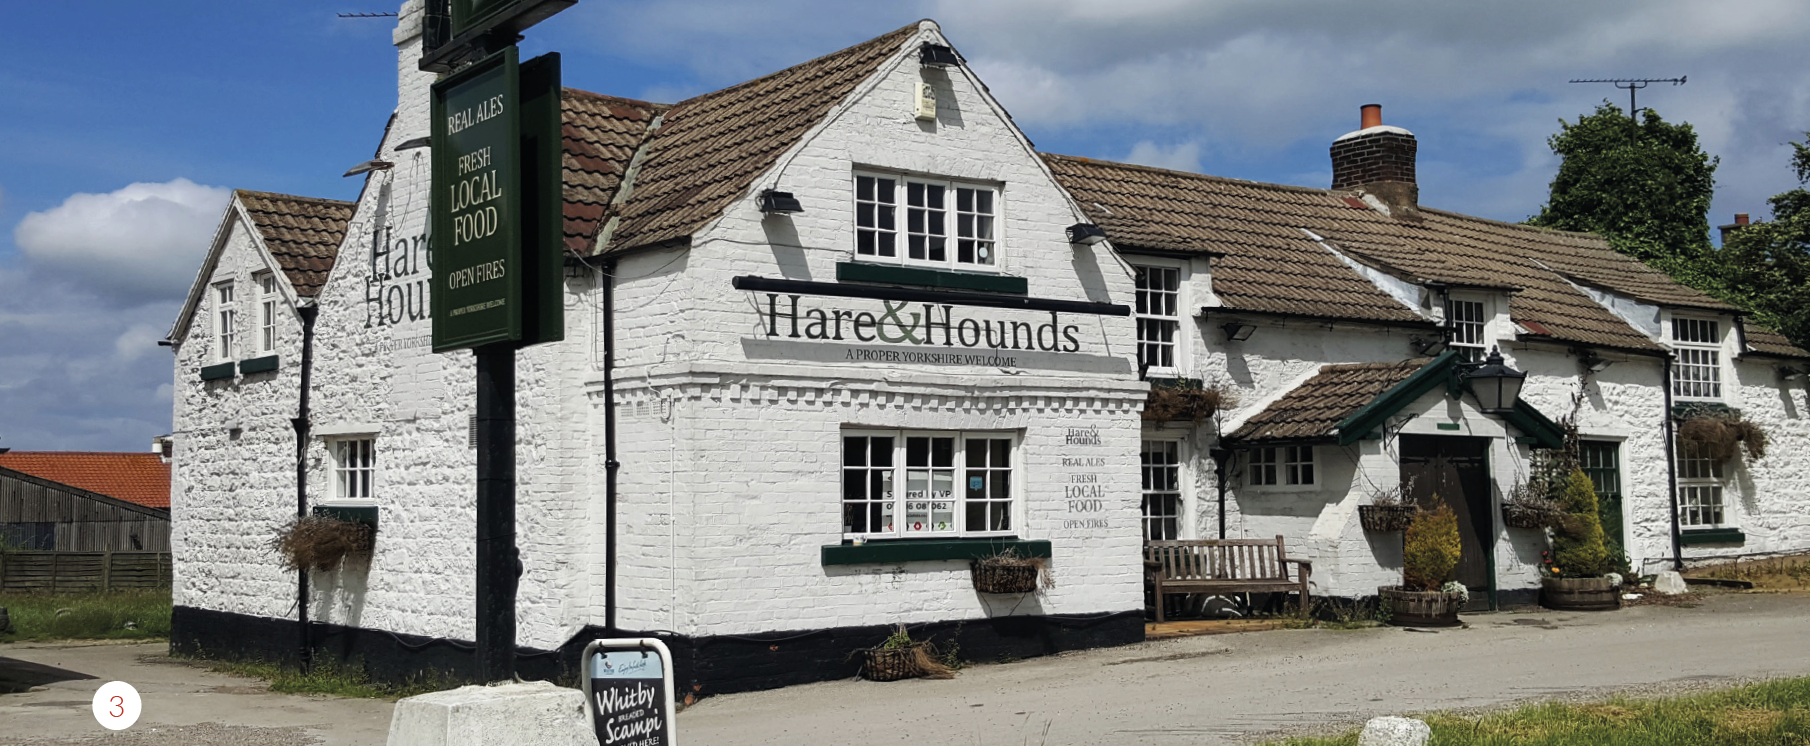
3. Hare & Hounds, Scarborough
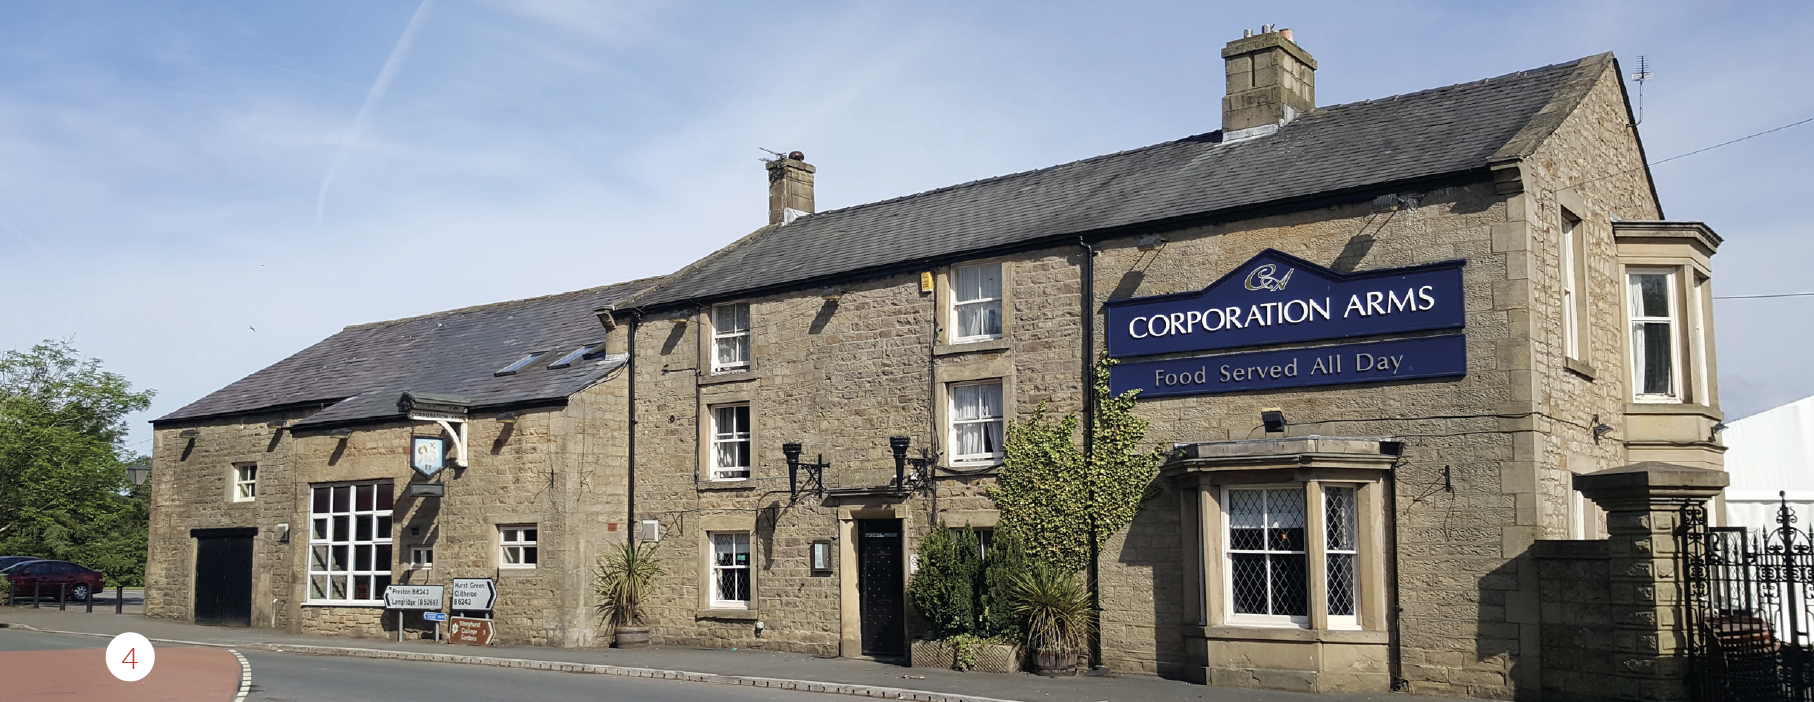
4. Corporation Arms, Longridge